The Ultimate Guide to Using Reports in WebPT
WebPT Members have access to even greater business intelligence that they can use to inform important operational decisions.


Subscribe
Get the latest news and tips directly in your inbox by subscribing to our monthly newsletter
The word “report” often carries a slightly negative connotation. After all, who honestly gets pumped up about things like book reports, progress reports, or TPS reports? But, when it comes to boosting and maintaining the health of your business, reports can be extremely valuable. And because there are already tons of awesome, easy-to-use reports available within WebPT, you don’t have to go far to take advantage of these tools. Plus, we recently launched Analytics, so WebPT Members have access to even greater business intelligence that they can use to inform important operational decisions. So, without further ado, here are all the WebPT reports you should be using on the regular:
Referral Reports
For rehab therapists, referrals are crucial to business success. So, it only makes sense that you’d want to stay on top of which referral sources are consistently sending you the most patients—and which may need a reminder about the value you provide. Using WebPT’s Referral Report, your clinic administrator can create a pie graph that displays your referral numbers by source. Here are two more ways you can analyze your referral data:
Referrals Analysis Grid

The Referrals Analysis Grid allows you to quickly track referral sources for patient cases—organized by information such as diagnosis and visit information. That way, you can tailor your marketing efforts to better reach referral sources, prioritize the ones whose patients end up completing the most visits, and consider realigning expectations with the referral sources whose patients bail on therapy before completing their course of care.
Referrals by Clinic
Referrals by clinic is a data-table-style report that enables you to compare referrals and conversion rates for a specific clinic location to a previous time-frame. Quickly view data by referral source, referral contact, or clinic to see how your marketing efforts are stacking up to previous weeks, months, or years. You can also add additional filters—such as referral type, insurance type, insurance, and diagnosis—to narrow the scope of the report. The total percent of all visits in the visits field should equal 100.
For detailed instructions on creating Referral Reports within WebPT, click here (WebPT Members only).
Notes Reports
While providing exceptional patient care takes time, you’ve still got to be sure that your therapists are making the most of the limited hours in the day to see as many patients as possible—without sacrificing quality, of course. That’s where WebPT’s Notes Reports come in—to help you get a handle on your staff’s productivity based on the number of patients seen and notes completed in a given time-frame. You can also use information on completed notes to stay on top of timely claim submissions—by ensuring that all patient notes that are billable are processed quickly.
Notes By Clinic
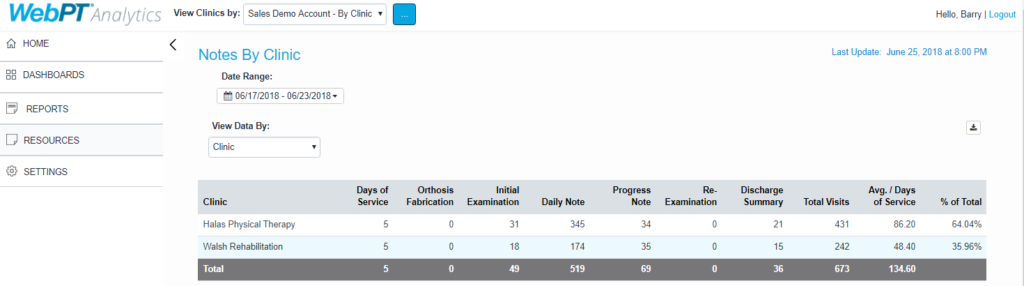
The primary purpose of this data-table-style report is to help you monitor staff productivity by clinic location, therapist, or date of service. You must select a date range to trigger the report to run. From there, you can view your data by clinic, therapist, or date of service. The “% of Total” column should add up to 100.
Patient Notes Report

This analysis-grid-style report provides data—including treating diagnosis—on all finalized notes that are billable. Notes are considered billable as long as they do not contain the code NC001.
For detailed instructions on creating Notes Reports within WebPT, click here (WebPT Members only).
Productivity Dashboard
We touched on productivity above, but it’s such an important metric for successful practices that we’ve gone ahead and created a productivity dashboard report complete with widgets on patients seen, cancellations and no shows, incomplete and missed notes, and a case overview, so you can monitor productivity at a glance.
Visits Reports
Ever wondered how your patients are using your services—and which insurance companies represent your top payers? Of course you have. After all, that’s pretty crucial information to have when making operational decisions and negotiating for higher payment rates. Well, WebPT’s Visits Reports detail all of that and more:
Patient Visits
The primary purpose of this analysis-grid-style report is to help you monitor patient progress and track scheduling information, including details about each patient’s last and next appointment. That way, you can ensure your patients are staying on the schedule—and completing their courses of care.
Patient Visits by Payer
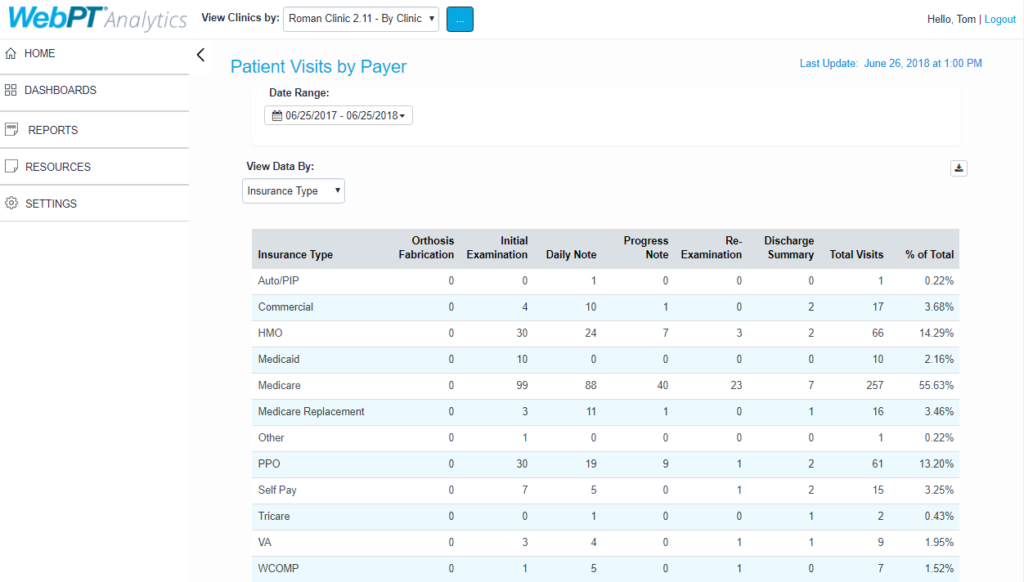
This report shows visit note type counts by insurance type, insurance, and clinic (only finalized, billable notes are included). That way, you’ll have the utilization information you need to make important decisions regarding relationships with insurance companies.
Patient Payments
The Patient Payments analysis grid is an operational report that allows you to monitor payments collected, including details about the charge type, who collected it, and at what location. Because patient payments are making up an ever-increasing portion of providers’ payment pie, tracking this kind of information can be invaluable to ensuring your practice remains financially solvent.
Authorizations
Use this analysis grid to discover information about authorized visit utilization across clinics. In other words, you’ll be able to tell whether or not your patients are using all of their authorized visits. And if they’re not, perhaps it’s time to get to the bottom of why.
Prescriptions
WebPT allows you to enter a patient’s prescription information directly within the patient record—or by uploading an external document via eDoc. You can also set in-app alerts to notify you when a patient's prescription has expired—or is about to. That way, you can ensure your patients’ prescriptions are always up to date and thus, that they receive continuity of care. Plus, with WebPT’s Prescriptions Report—an analysis-grid-style report—you’ll be able to uncover information about prescribed visit utilization across clinics.
For detailed instructions on creating Visit Reports within WebPT, click here (WebPT Members only).
Billed Units Reports
Curious to know which insurance companies make up the highest percentage of your payments? What about how much revenue each CPT code has generated for your clinic this year? You can pull all that data and more using WebPT’s Billed Units Reports.
Billed Units Analysis
This is an analysis-grid-style report providing the CPT code and number of units for every billable service. A unit is billable if it occurs in a finalized note and does not contain the NC001 code. You can filter data by specific date ranges, including yesterday, this month, last month, this quarter, and custom.
Billed Units by Payer
Billed Units by Payer is a data-table-style report that displays billed unit counts by insurance type, insurance, or CPT code (including modifiers). Units are only included if they are contained in finalized billable notes. To drill down even further, filter the report by therapists, insurance types, insurance names, and/or CPT codes.
Billed Units by Clinic
This data-table-style report displays billed units for each type of visit. You can view data by clinic or therapist and further filter the report by therapist, insurance type, and insurance.
Claims Feed Report
Monitor your claim transmissions to your integrated billing partner across all clinics to ensure you spot data problems or omissions that could prevent your information from carrying over to your billing system. You can also use this report’s dynamic filters to easily locate specific transmissions by type, therapist, patient, or status for a specific date range. You can adjust the data you see using the “View Clinics by…” dropdown menu in the header. Similar to how the report functions in the EMR, you can choose to view the data by transmission date (default) or by date of service.
For detailed instructions on creating Billed Unit Reports within WebPT, click here (WebPT Members only).
Key Performance Indicators (KPIs)
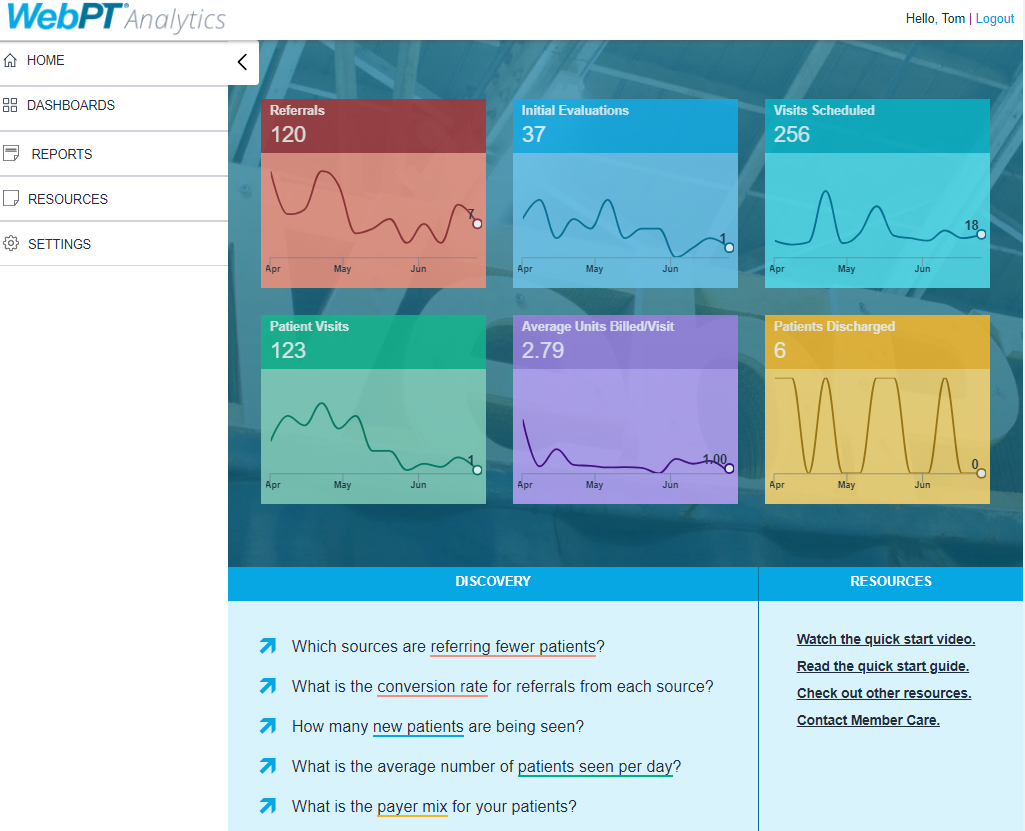
There’s a lot to measure, monitor, and track to ensure your practice is operating at its best. That’s why we’ve taken the most important key performance indicators (KPIs) and organized them as simply as possible. That way, you can quickly see how your business is performing. Want to drill down deeper on a particular KPI? Simply click a tile to access more information on that specific indicator.
Referrals
Track the volume of referrals coming into the clinic over the past 90 days and identify trends in weekly averages. Clicking this tile opens the Referrals by Clinic report mentioned above.
Initial Evaluations
Measure the total number of referrals that translated into new patients (in other words, your clinic’s conversion rate). Clicking this tile opens the Notes by Clinic report mentioned above.
Visits Scheduled
Track the total number of visits scheduled (includes cancellations and no-shows) and compare that number to the number of visits patients actually attend. Clicking this tile opens the Productivity Dashboard. Check out the Patients Seen section of the Dashboard for more details.
Patient Visits
Manage your arrivals by measuring how many patients show up for their scheduled visits. Clicking this tile opens the Notes by Clinic report.
Average Units Billed Per Visit
Review the average number of units billed for each finalized note to achieve greater insight into treatment volume. This does not include no-charge visits, G-codes, or L-codes. Clicking this tile opens the Billed Units by Payer report.
Patients Discharged
See the number of patient discharges (including both full- and quick-discharge note types) and compare that figure to the number of initial evaluations displayed in the above-mentioned Initial Evaluations report. That way, you can better understand the inflow and outflow of patients. Clicking this tile opens the Notes by Clinic report.
For detailed instructions on creating KPI Reports within WebPT, click here (WebPT Members only).
There you have it—a plethora of easy-to-use, super-slick reports that could catapult your clinic to new heights of business success. What do you think? Have you used any of these reports to streamline your practice’s operations or business strategies? Or, do you plan to? Share your thoughts in the comments below.